Family Tree DNA has updated their MyOrigins results to Version 3.0. In this post, learn why your FTDNA results changed, and what's new, and how to understand these results.
If you tested your DNA with Family Tree DNA (FTDNA) or uploaded your DNA to the site, then you already know how amazing Family Tree DNA results are. It may have been a bit of a surprise to log in to your account to see that your results have gotten even better!
Until recently, my favorite aspect of the FTDNA results, overall, has been the DNA match list. With the chromosome browser and all of the very cool ways you can sort and filter your matches, I have found it to be very useful
But now, with this update, I have found the MyOrigins results to be more fascinating than before. Let's dig into the details of this Version 3.0 update to learn exactly what's new and what it means for us.
Why did your Family Tree DNA results change?
The science and technology behind DNA testing, including estimating ancestral origins, has improved dramatically since Family Tree DNA first released the MyOrigins estimate in 2014. FTDNA has applied information learned from new research, as well as updated algorithms, to provide its customers with improved MyOrigins results.
Most people will find that their results have changed, and will see more detail and accuracy. For example, someone who had regions matching the "New World" on their old results (see below) will certainly see their results include new regions on this update.
These are the old results for New World regions:
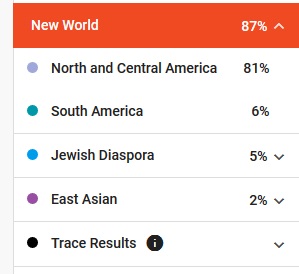
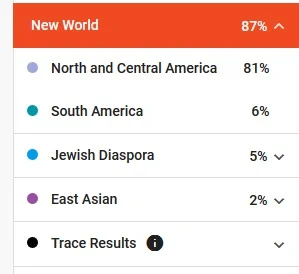
The 87% matching the "New World" has been updated to 90% "Americas", and then we also see matching to individual sub-regions on the North and South American continents. You might wonder how the percentage increased from 87% to 90% for this region, and this is because we see the 2% East Asian correctly assigned to the Americas region instead.

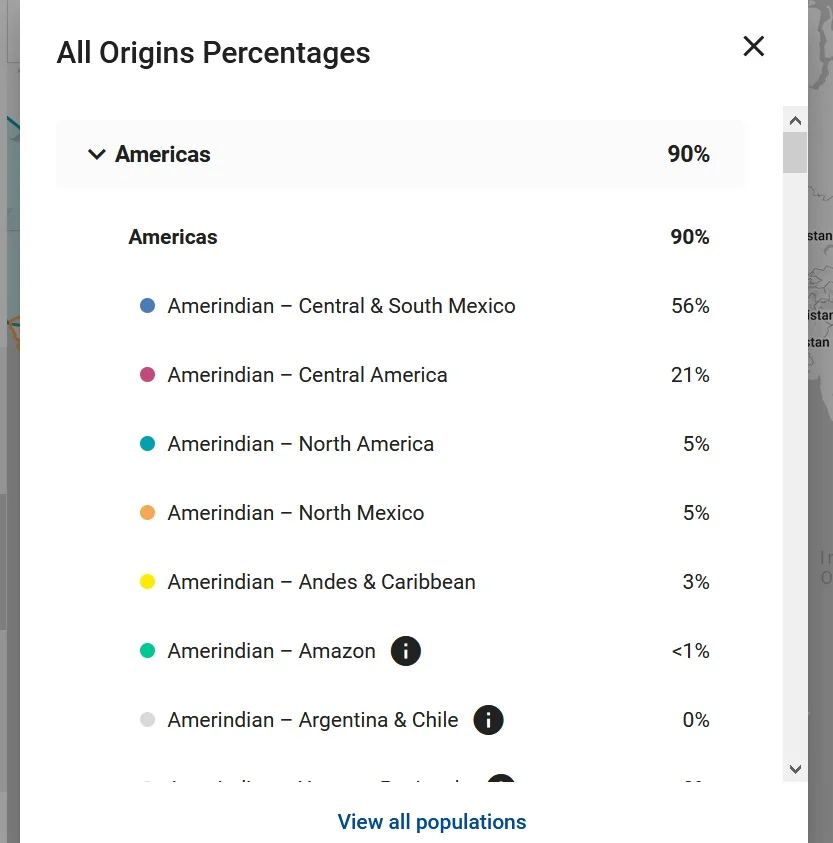
Almost everyone will notice that their MyOrigins results changed in a similar way with this update. The continents, generally speaking, are the same, but we might notice matching to new regions within the larger geographic area.
Of course, as we already know, our DNA results can never exactly match our family tree. This is because we do not inherit DNA from all of our ancestors in equal parts.
In addition, we often find that our ancestors were often more genetically diverse than we might expect. They traveled and mingled with neighboring regions just like we do today.
What is different with the MyOrigins Version 3.0 update?
The main difference between the MyOrigins 3.0 and the previous version of the results will be the number of regions that Family Tree DNA now reports on results. Version 2.0 included only 24 populations worldwide, and the new version has increased this to 90.
Most interestingly, we see a big increase in the non-European populations reported. For example:
- African regions have increased from 4 to 21
- Asia and Oceania regions increased from 6 to 33
We also find more European and Middle Eastern regions on the results (increased from 12 to 27). On our wish list for the next update, we can include more North and South American sub-regions, since populations for this region only increased from 2 to 9.
Prior to this new update, we had not seen updated MyOrigins results since Version 2.0 in 2017. This is very exciting for everyone who has their DNA on FTDNA.
Does this mean that your results were wrong before?
If your DNA results have updated, it does not mean that they were wrong before. Simply put, they are now better and more accurate than they were before.
Example of updated FTDNA results
I love to include case studies with posts, and this article is no different. Below, I have included Family Tree DNA Results that have been updated from the MyOrigns 2.0 to 3.0.
The results below are from someone with three grandparents born in Europe. The fourth grandparent was born in Chicago, Illinois, to parents who had recently immigrated to the United States.
All known ancestors were German and Dutch. In addition, there is a possibility that one great-grandparent (on the German side) was Polish.
First, we'll take a peek at the old results. They show 100% European ancestry, with the largest percentages belonging to West and Central Europe, Eastern Europe, and the British Isles.
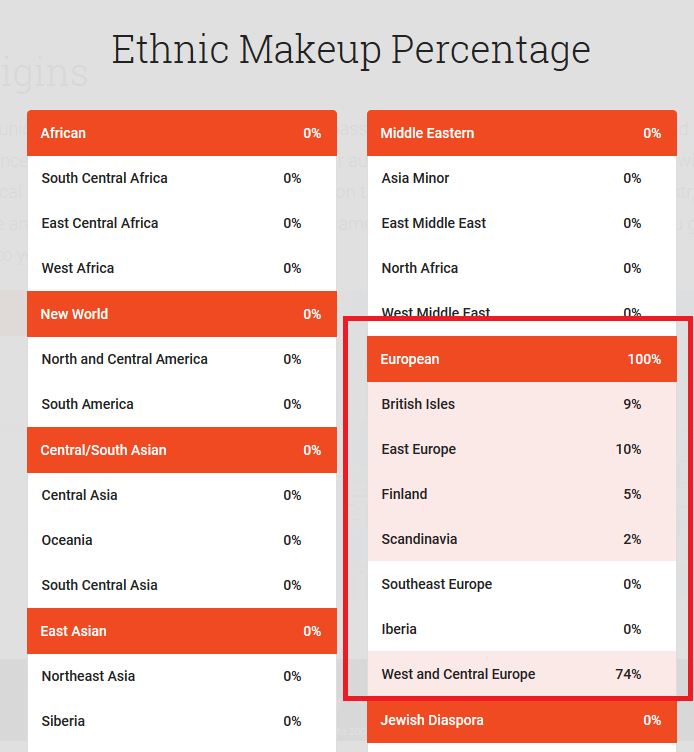

These results were great, and answered a lot of our questions about our test taker's ancestry. However, the updated results with the MyOrigins Version 3.0 are even better!
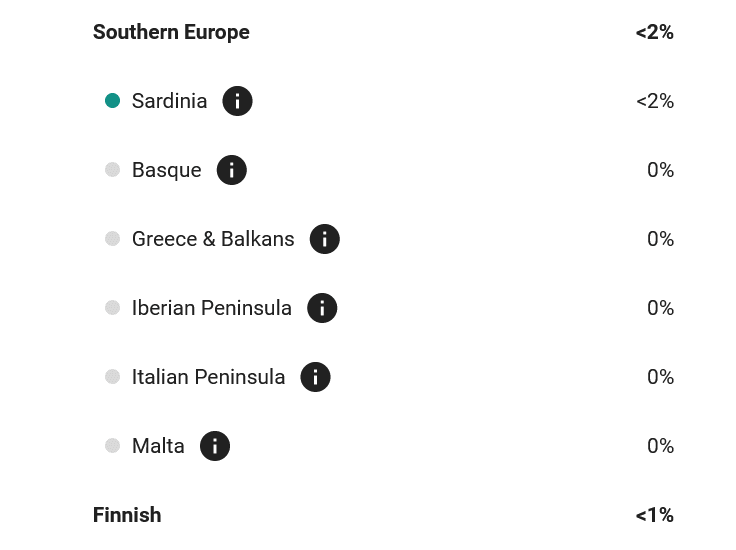
Below, find the same person's updated results. As you can see, still 100% European, but there are definitely regions there that were not represented on their previous results.

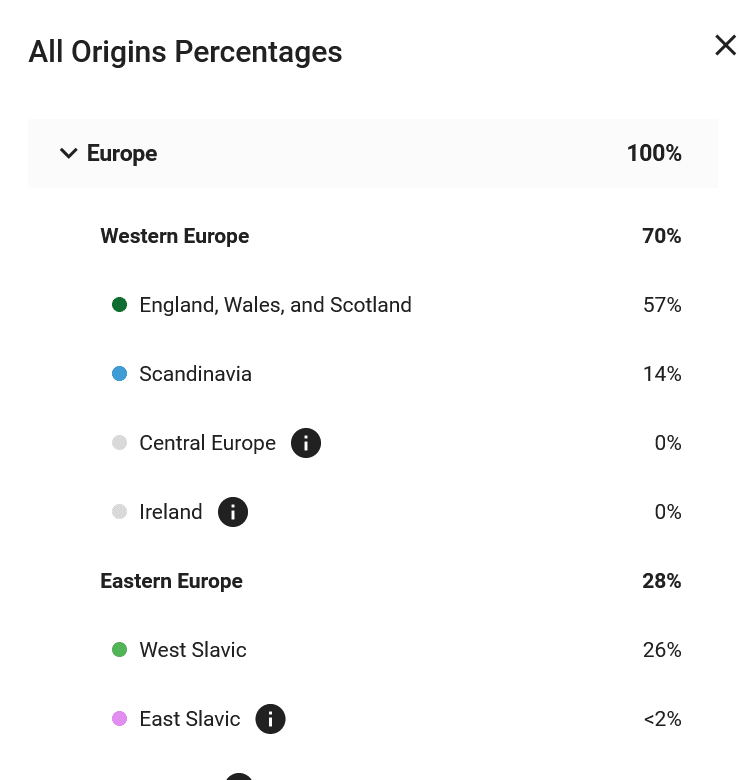

Even though this test taker has German ancestry, their German ancestors were from the German part of the Pomerania region, which happens to be adjacent to Poland, right on the Baltic Sea. This means that instead of the West and Central Europe region that we saw on the previous results, West Slavic better matches their German roots.
Many people might expect for someone with 50% Dutch ancestry to show Central Europe, instead of matching the England, Wales, and Scotland region. This is curious, and could possibly mean that this person's Dutch ancestors may have had roots in what we now know as the UK.
While this might seem odd, a quick look at Google maps shows that the coast of England is as close as about 83 miles (135 kms) from the coast of the Netherlands. In other words, the regions are very close geographically, and people from these regions can share common origins.
Conclusion
I hope that this post has helped you learn more about your Family Tree DNA results, why they changed, whether they were wrong before, and that you found the case study of updated results interesting.
If you have any questions about something that you have read here, or if you found an aspect of your updated results especially interesting, I would love to hear from you in the discussion below.
Thanks for stopping by!