Did you get 1% of an unexpected region in your DNA results? Maybe your ethnicity estimate shows 1% Irish, 1% European Jewish, 1% Bantu, or 1% North African DNA. You might be tempted to brush off these "trace" amounts of DNA from a particular region as statistical noise, but should you?
In this post, I am going to explain to you why and how I believe that you should thoroughly investigate every region on your ethnicity estimate or ancestry composition report in order to learn as much as you can about your ancestors.
In short, don't ignore your 2%, 1% or even less than 1% regions and disregard them as noise.
If tracking down the ancestor that might have contributed a very small amount of an ethnicity region to you seems daunting, don't worry! You can follow the tips that I suggest to learn from whom you may have inherited your trace ethnicities, too.
As an example, I am also going to show you the steps I took to determine which ancestral line contributed my dad's North African and Arabian ancestry which showed up as a minuscule .3% on his 23andMe results.


Is your 1% DNA region plausible?
History never ceases to surprise me. For example, I've been working on tracking down my mom's 1% Southeastern Bantu ancestry. All of her lines on her Bantu side of the family, as far as I've traced, go to England, Ireland, and Scotland.
Initially, I was tempted to write her 1% Southeastern Bantu ancestry off as noise, but then I learned that many thousands of enslaved individuals were taken from Africa to the British Isles.
I had been thinking about her ancestry from an American-centric point of view, and assumed that she must have been descended from an enslaved person brought to North America.
Now that I understand that she could have inherited her Bantu ancestry from one of her English, Irish, or Scottish ancestors, I can expand my search - and hopefully, discover the identity of my Bantu ancestor.
Have you built a family tree?
I'm going to address the elephant in the room. How can we have a serious discussion about whether or not a 1% (or 5%, for that matter) region in our ethnicity results is noise - or not - unless we've begun the important work of trying to determine where many of our ancestors came from.
In other words, how can we know what is plausible - or even possible - when we don't have a thorough knowledge of our family tree?
Yes, most of us know that Grandpa was born in Philadelphia, and Grandma's parents were Scottish, and Dad's parents were from Germany and Nigeria. Based on this cursory knowledge of our ancestry, we would be surprised to find 1% Native American, or 2% European Jewish in our results.
Generally speaking, we all have:
- 4 grandparents
- 8 great-grandparents
- 16 great-great grandparents
- 32 great-great-great grandparents
- 64 great-great-great grandparents
- 128 great-great-great-great grandparents
Based on our understanding of DNA inheritance, we know that we inherited DNA from most of our great-great-great-great grandparents.
Do you know who all 128 of your great-great-great-great grandparents were, where they were born, and where their families came from?
I recommend building trees on Ancestry. It's free to start and keep a tree, you can connect it to your DNA results, and it's very easy to use. I'm a huge fan of Ancestry's tree building site.
Have you gotten a second opinion about your trace ethnicity region?
When my dad first did his Ancestry DNA test, he received 1% North Africa on his results. Based on what I knew of my dad's family tree, I was surprised to see this region on his ethnicity estimate.
One of the first things that I did with my dad's DNA was upload it to Gedmatch. On this site, they have a number of admixture calculators that were designed by various researchers.
Each calculator has a different focus, so it's helpful to play around with them to see what you find.
For example, I ran my dad's DNA through the MDLP K16 calculator on Gedmatch, and the generalized proportions matched very well to what he was seeing on his Ancestry DNA results. Plus, there was a small percentage of North African reported (.48%).
For several reasons, including wanting to know more about this small percentage of possibly North African ancestry, I asked him if he would be willing to take a DNA test with 23andMe.
Check this out:
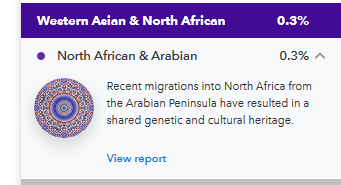
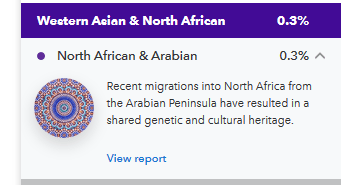
So yes, it's a super small percentage and indicates very distant North African ancestry. But I like a challenge. During the rest of this post, I'll tell you a few things that I did to help me determine which two out of 128 great-great-great-great grandparents likely passed this down to my dad.
DNA matches are key to researching trace ethnicity regions
If you are serious about genealogy and DNA testing, I recommend learning about chromosome mapping. A really cool website called "DNA Painter" makes it simple to do, so don't worry.
Our DNA matches share DNA segments with us that were inherited from our common ancestors. Many DNA testing companies, as well as Gedmatch, allow access to something called a "chromosome browser", which shows us the exact location on our chromosomes where our shared DNA segments with our matches are located.
There are lots of ways to keep track of this "segment data", as I call it. DNA Painter is my favorite way. It is quick and easy, and is a simple way to visualize where our DNA matches fall on our chromosomes.
I've only "painted" about 26% of my dad's DNA (as shown in the image below), but I've painted in enough DNA matches (by pasting in the segment data from the chromosome browsers) to start to get a feeling about which ancestors may have passed down a particular ethnicity.
If I click on a chromosome, I will be able to see the names of the DNA matches that match me on the segments you can see painted below.

The "real" magic happens next.
23andMe allows you to download segment data pertaining to ancestry regions
23andMe allows you to download detailed segment data revealing which DNA segments (from your DNA matches) on which chromosomes correspond with the reported ancestry region. In just a few easy steps, you can paste this data into your DNA Painter profile.
The ethnicity/ancestry segments will show up just like a segment from a DNA match.
In the case of tracing a "trace" ethnicity region, what we would look for is a DNA segment shared with a match that overlaps with the ethnicity region in question.
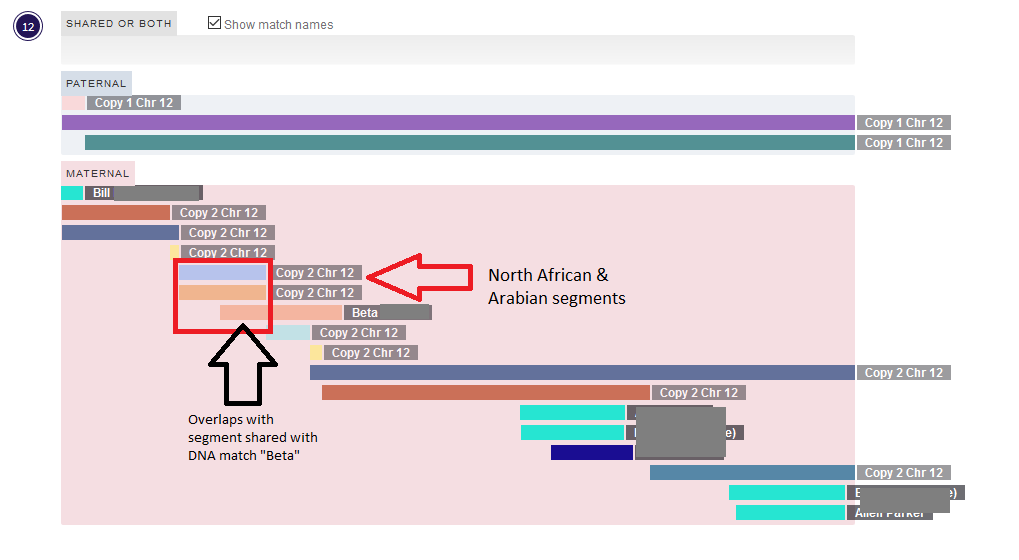
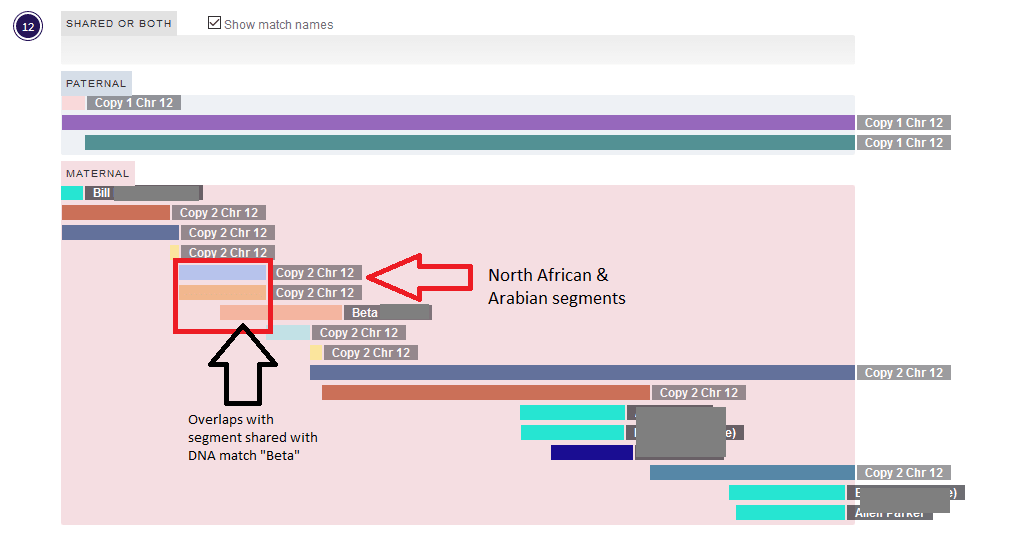
My dad's North African DNA segment is on Chromosome 12, and happens to overlap with a segment shared with his match named "Beta". I know which ancestors my dad shares with Beta, and so I now know which ancestors possibly passed down the North African DNA to my dad.
Take a look at the segment data for Chromosome 12 that I have painted in for my dad on DNA Painter:
It's probably worth testing with 23andMe only to get access to this ethnicity data, especially if there is a region that you are very curious about. After learning how helpful this segment data is, I have had several other family members test in order to narrow down my various searches even more.
The next step? Learning more about the ancestors that my dad shares with Beta! I've traced those lines back quite a ways, but there are a few places where I have gotten stuck.
Maybe I should focus more on those ancestors to see which secrets they will reveal to me?
Okay, trace regions are sometimes noise
It's important to acknowledge that ethnicity estimates are a new technology, and although companies put a lot of resources into giving us accurate results, it's possible that small regions (or even larger regions) are inaccurate.
But it's WAY more fun to jump headfirst into this research and see where it takes you. And that's why I always suggest that we follow the DNA, leaving no chromosome or DNA segment un-turned 🙂

Conclusion
I hope that this post helped you learn why it is important that you research and learn about all of the branches of your family tree. Even a small amount of a particular ethnicity region can be a clue to a very exciting part of your family story.
If you have any questions about something that you read in this post, or if you would like to add your experience tracking down your trace ethnicity regions, I would love to hear from you in the discussion below.
Thanks for being here today!
Tim from Northeast Kansas
Sunday 26th of January 2025
I eliminated all except for 1 of my 1% Ethnicity Regions simply by maintaining what I have and pushing further back in time while triangulating with my Genetic Networks. My 1% Ethnicity Estimate is Scottish which dropped to 1% from 10% last year. I have confirmed my 2% Balkans and 2% Baltics. My 2% Baltics comes from my Ancestors from Galicia and Volyn Oblast,Ukraine which they came from Galicia. The Surname Ancestors from Volyn Oblast, Ukraine came from Right Bank Kyiv Vovoideship, Poland now modern Ukraine.
Jeff
Sunday 15th of January 2023
How are you doing hoping you are having a blessed life I have 97% African and 4% European the test was done by Ancestry DNA, do this Make Me Full African God Blessed.
Steve
Wednesday 14th of December 2022
There were no Bantu slaves in Britain. No slaves were allowed in Britain since 1107. It was against the law of the land to have slaves in Britain since that time. You need to correct your misinformation.
Michael King
Friday 2nd of May 2025
@Steve, 80% of Africans can be considered Bantu. Your comment appears to conflict with the information at https://en.wikipedia.org/wiki/Slavery_in_Britain which describes a much more complex situation.
Loretta Irene Henry
Friday 12th of November 2021
Thank you for this info, it speaks to a similar point of bewilderment. My entire recent family is from the English speaking Caribbean, so using Ancestry, seeing 3% England was far from a surprise but the 1% Eastern Europe and Russia -aka stated as 1.7% Central Asian (the "astans") on My Heritage threw me for a loop! Furthermore, with pages and pages of matches, so far the ONLY one I see sharing this percentage is my late dad's first cousin which would sync with the most likely line this would have come from. Ancestry also generated 9% Cameroon, Congo and Western Bantu but My Heritage somehow named it 11.7% Kenyan, which also was surprising cause I'd never seen it on Ancestry. I understand some regions that are adjacent to one another can cause this discrepancy in description but it's confusing to me and due to "colonialism" in the Caribbean, I think solving these mysteries will be all the more challenging - any thoughts (meaning can I hire you to do it for me, LOL?)
Mercedes
Sunday 15th of August 2021
Thank you so much for noticing that! I always appreciate the extra eyes to spot mistakes :)