Have you been examining your Ancestry DNA results since they went through the major 2018 update? You are not alone!
Many people find themselves confused, frustrated, excited, or even sad and angry about the major changes their results have undergone. To some people, their ethnicity estimate is confirmation of their identity - especially when it seems to perfectly match their known family history.
When it doesn't line up with expectations, it can cause major disappointment.
My general opinion is that this update has brought positive changes to our ethnicity results. We can feel more confident in the regions that are reported on our estimates, and we will no longer find ourselves chasing ghosts trying to track down mysterious "low confidence regions" that may or may not have been accurate.
Despite this, the updates might leave some of leave us with lingering questions.
In this post, I'll show you four before and after comparisons that will hopefully illustrate the benefits of the update, as well as give you an idea as to the questions that you could be asking yourself about your own results post-update.
The comparisons are for people with diverse backgrounds:
- 100% European heritage
- 1 parent US-born with European ancestry, 1 parent Mexican
- 100% Native American, Mexican born
- 1 parent US-born with European ancestry, 1 parent born in Philippines
Ancestry 2018 update comparison: European ancestry
My own recent ancestry is European, and this is where Ancestry DNA has the most regions, sub-regions, and even sub-sub-regions that they test for. My expectations for this update were high.
I really was hoping that they could report a more specific sub-region for some of my European regions.
European Ancestry update results example
In the image below, you can see a side-by-side comparison of my Ancestry DNA results before the update and after the update. Below the image, I'll tell you how the update lived up to what I was hoping for.
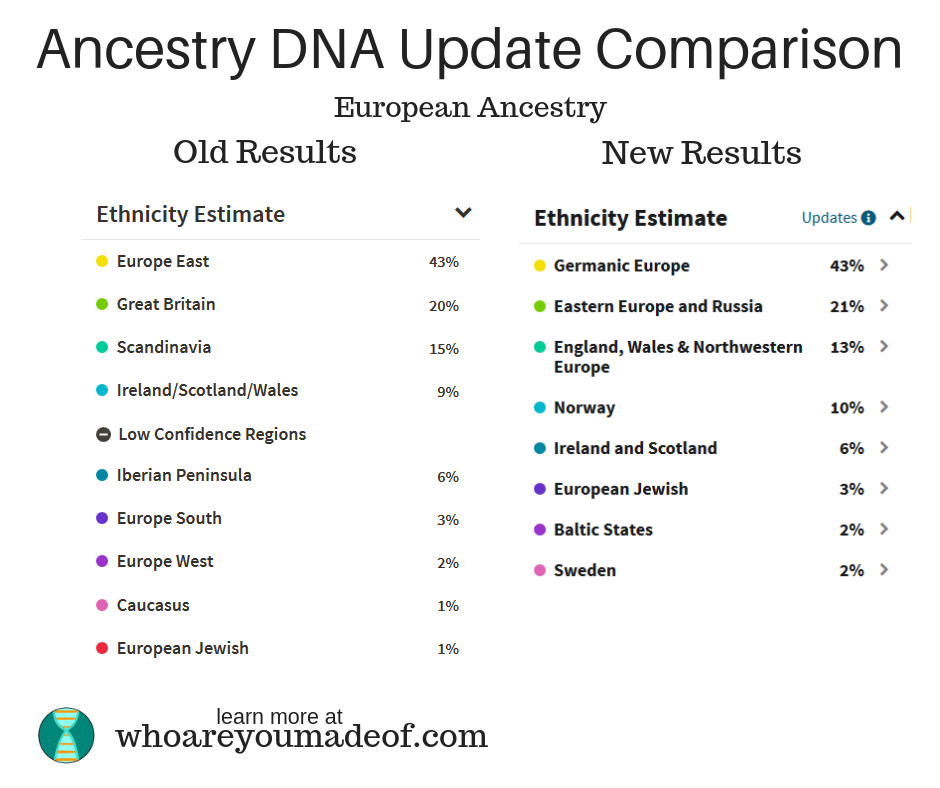

Discussion of these new results - Scandinavian defined
I was very happy with how Ancestry was able to refine my 15% Scandinavian percentage to a more definitive 10% Norway and 2% Sweden. I had been puzzling over my large Scandinavian percentage for a very long time, trying to narrow it down to the exact line of my family where it came from.
My grandmother also had more than 35% Scandinavian, which led me to look at her primarily British family tree with suspicion. Her Scandinavian completely disappeared with the update, however, and now I am 100% sure which line of the family gave me my Norwegian and Sweden DNA (paternal grandfather's line).
Update brings increase in European Jewish
Another element of my new results was the increase in European Jewish. I had found substantial evidence of legitimate European Jewish in my DNA from 23 and Me and My Heritage, and am working on narrowing it down via chromosome painting (it's fun - really!).
Seeing my percentage increase from 1% to 3% on Ancestry was a positive for me.
Broad categories mean more accuracy
I am, however, disappointed that the Germanic Europe category covers such a broad territory, just like the other two ethnicity regions you'll see in my new results (Eastern Europe & Russia, and the British/Northwestern Europe ethnicity).
Ancestry DNA definitely gives us more accuracy by adjusting the region and broadening definitions, but I was hoping to see more specificity in these exact regions.
You also might notice that my Iberian Peninsula has completely disappeared, as it has for everyone.
Ancestry 2018 update comparison: Native American ancestry
My husband was born in an indigenous village in Mexico, not too far from Mexico City, where Nahuatl is spoken by most adults, and many Pre-Colombian influences remain. I wondered if Ancestry DNA would be able to tell us more about his Native American ancestry, and if his trace European ethnicity regions would expand, or be more detailed in the updated version of his ethnicity results.
Native American Ancestry update results example
The images below show comparisons the comparison between my husband's Ancestry DNA ethnicity results from before and after the update:

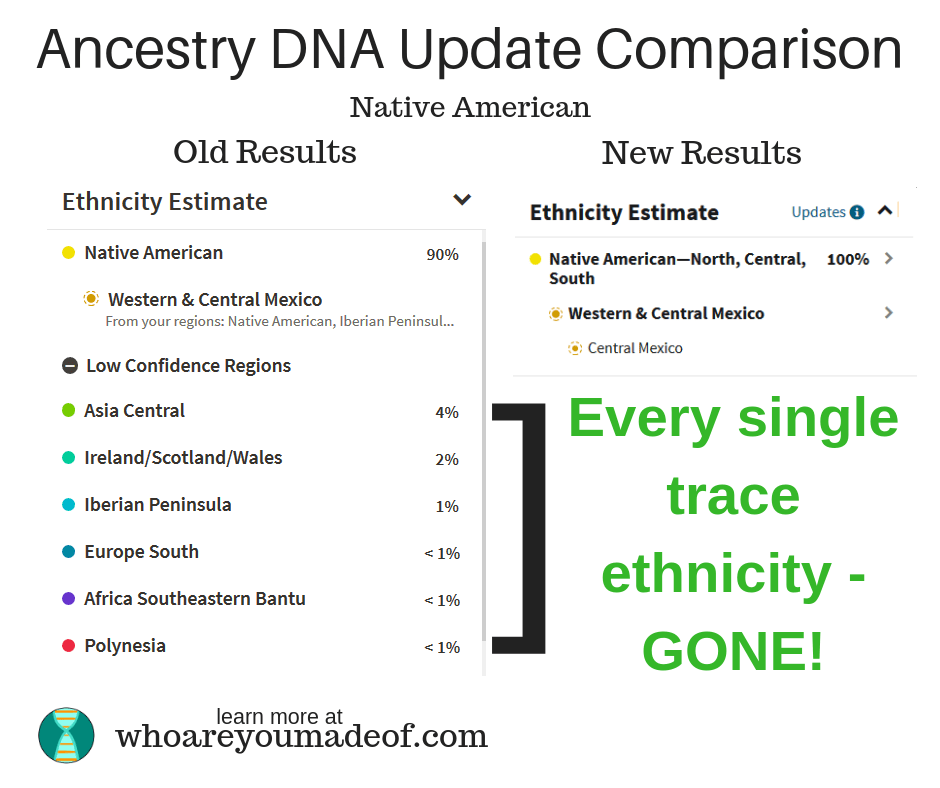
Discussion of these new results - 100% Native American DNA?
As you can see from the image above, my husband's Native American increased from 90% to a whopping 100%. He was assigned the Western and Central Mexico sub-region on both versions of the results, which is correct.
His hometown is located within the region shown on the map in Central Mexico, which gave us confidence (prior to the update) that the results could be trusted. We had noticed that his ethnicity results didn't total to a "neat" 100%, and so weren't surprised to see his Native American increase, but we were surprised that it went to 100%.
All low confidence regions completely gone with the update
Another surprise was that his low-confidence regions, also known as trace regions, completely disappeared. This is what left him most skeptical.
There have been migrants (both willing and unwilling) in Mexico from Africa, Asia, and Europe for more than 500 years, and so the trace regions that appeared on his old results seemed very plausible. In addition, he has numerous distant DNA matches from Ireland and Spain, and while this isn't proof positive of him having a particular ancestry, it did give reason to believe that it should be investigated.
My general thoughts on this particular comparison is that my husband likely does have more than 90% Native American DNA, and this is reflected on his newest results. Another family member from the same town also tested and received 93% Native American on Family Tree DNA.
I do question the disappearance of the low-confidence regions, and this leads me to wonder about the reference population used to compare my husband's DNA. Additionally, the results generally are "more accurate" in the sense that the speculative regions have been removed.
Ancestry 2018 update comparison: Latin American ancestry (Mexico)
My adult daughter, who has given me carte blanche to discuss, examine, and dissect her DNA for this post, has Mexican ancestry from her biological father's side (not my husband) of her family. Her father was born in a small town in coastal Guerrero, Mexico, near Oaxaca.
Most people from this region of Mexico have significant African ancestry, as well as Native American (indigenous Mexican), and European roots.
Latin American Ancestry update results example
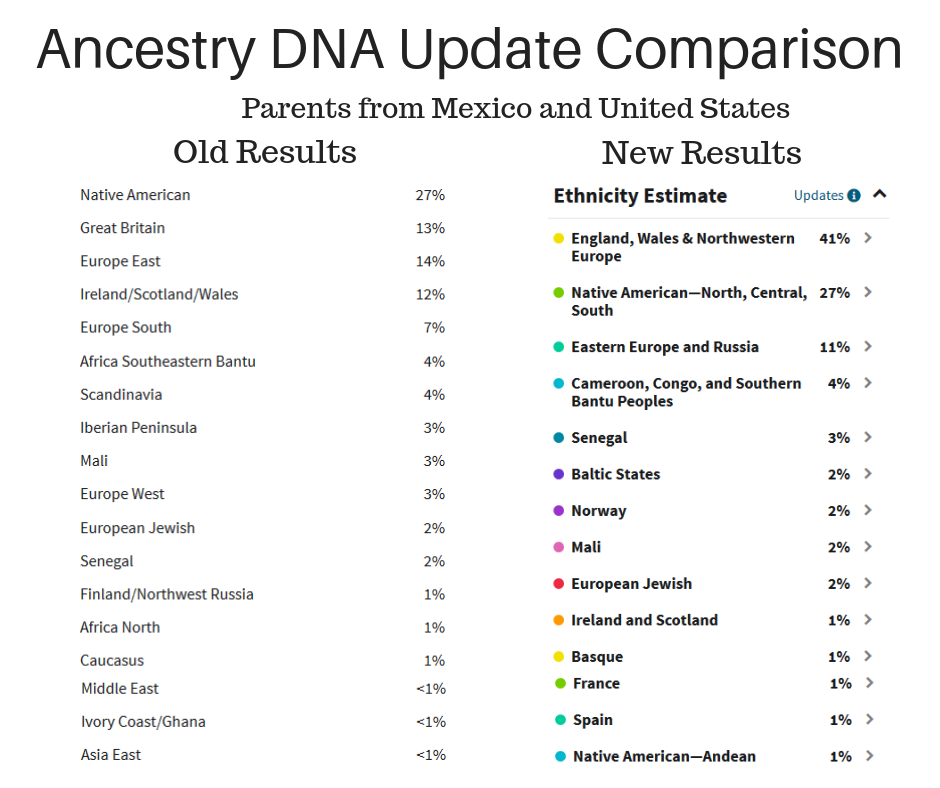
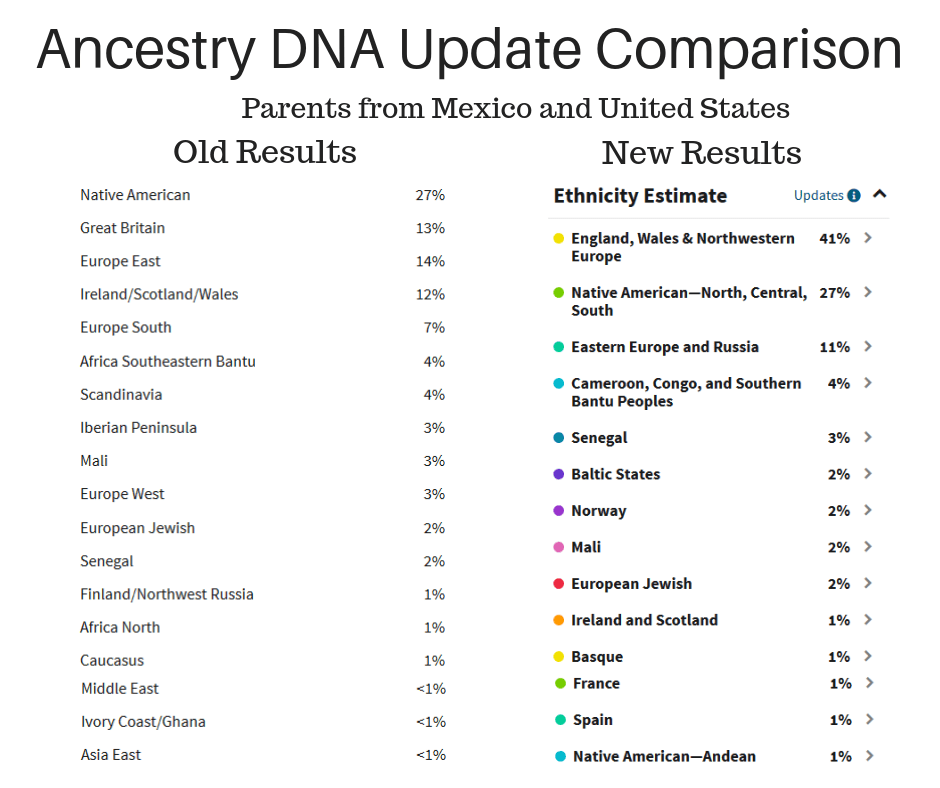
In the image below, you can see my daughter's DNA results. You can also compare them to my results (the first comparison above), if you are interested in knowing which DNA ethnicity regions she likely inherited from her American mother and Mexican father.
Discussion on these new results
There is so much to say about her updated results! I'll try to keep it short, though, and I won't go on and on about how disappointed she was to see her Irish percentage drop dramatically from 12% to 1%!
It is the opposite of what she was hoping for, which was maybe being able to identify the specific region of Ireland where her ancestors were from.
Andean DNA in Mexico?
The part of her results that we both immediately noticed was the 1% Native American - Andean ethnicity that was listed at the bottom of her results. How likely is it that her father, born in Mexico, but not terribly far from Central America, has ancestors from South America?
I have seen many people test with other companies and have Native American be mistaken for East Asian, or Amazonian, but I have not seen this happen with Ancestry results (yet). The jury is still out on this - for now.
If anyone has any ideas about this, no matter how improbable, I'd love to hear them.
Iberian didn't disappear for everyone
We were interested to note that her Iberian Peninsula was adjusted to France, Spain, and Basque, instead of completely disappearing like it did for so many others who had puzzled over the ethnicity region for so long.
Her African percentages stayed similar, but they are no longer referred to as "low confidence", and so maybe we can feel more confident about the validity of those regions; they also match perfectly with known history of the region where her father is from.
Ancestry 2018 update comparison: Asian ancestry
Some people with Asian ancestry will find themselves very excited about their updated Ancestry DNA results. Instead of only a few sub-regions of Asia, a large and diverse geographic area to summarize in only four ethnicity regions, Ancestry DNA now has twelve regions covering most of Asia.
Much work still needs to be done in defining more detailed regions within the twelve Asian regions, but this is a very big improvement over what was previously available on the site.
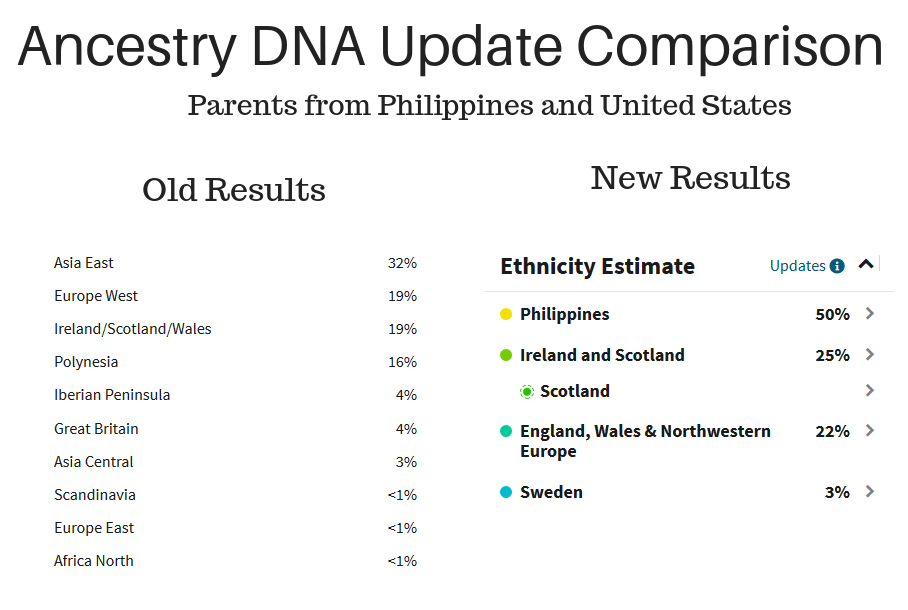
I have an update comparison to share with you from someone who has one parent from the Philippines and one parent from the United States with European ancestry.
Even though Ancestry DNA did previously have an East Asian sub-category corresponding to the Philippines, this test taker was disappointed that their DNA didn't match this region (in the old results), and was hoping to learn about about their DNA from the update.
Asian Ancestry update results example
Below, you can see the old vs. new results for this person of Philippine/American (European) heritage:

Discussion of these new results
Needless to say, this person was very happy with their updated DNA results. Even though they felt sure that their heritage was truly in the Philippines, it did feel good to actually see it on their ethnicity results as its own stand-alone ethnicity region.
You'll notice that the Asia East and the Polynesia almost combined neatly for the 50% Philippines, which eliminated questions about how they might have inherited Polynesian DNA.
Furthermore, their American parent's Scottish ancestry showed up very clearly under the Ireland and Scotland category in the Scotland sub-region, and the Scandinavian was refined to Sweden. Lots of questions answered!
Conclusion
I hope that you got some ideas from this post about what to look for in your "new" Ancestry DNA ethnicity results. Additionally, my goal was to help you understand whether or not your results are accurate, and how accurate they might be.
As always, if you have any questions about something that you read in this post, or would like to share your own experience with your updated ethnicity results, I would love to hear from you in the discussion below.
Thanks for stopping by!
elizabeth lobo
Tuesday 21st of June 2022
need a update dna 2015- elizabeth family tree lobo family tree rodriques family tree renae wallace my daughter family tree
Kimberly Swett
Saturday 6th of June 2020
In the old version, I had 48% Great Britain; 25% Scandinavian; 20% Irish/Scottish/Wales; 2% Benin/Togo; 1% Caucasis and less than 1% of South Asia, Europe East, Middle East and European Jewish. In the updated version I am 85% English, Wales and Northwest Europe; 10 % Irish and Scottish; 4% Norwegian; 1% Nigerian. Where did my less than 1% ancestry go to?