Do you want to know how to use the Gedmatch One to One comparison tool? This tool is one of the most useful tools on the site, and in this post, I'll teach you all about using it.
Most people find their way to the One-to-One tool after they have found an interesting match on the One-to-Many comparison tool and would like to examine the match more closely. This is one of the most common uses for the One-to-One tool.
In the article below, you'll learn:
- What you can learn from the Gedmatch One-to-One tool
- How to use the Gedmatch One-to-One tool
- How to understand the Gedmatch One-to-One results
- How to adjust the tool settings
What can you learn from the Gedmatch One to One tool?
I have two favorite tools on Gedmatch. The One-to-Many tool makes the list, naturally, but I absolutely LOVE being able to compare my DNA with that of my DNA matches using the One-to-One tool.
The Gedmatch One-to-One tool allows us to compare our DNA with our matches at the chromosome level, reporting detailed segment data.
If this sounds complicated, don't worry! It's easier than you might imagine to make sense of Gedmatch One-to-One results.
What does the One-to-One tool tell you?
The Gedmatch One-to-One tool compares your DNA with that of another Gedmatch user. If the software detects matching DNA segments between you and the other user, the segments will be listed on the results.
The information that we can learn from this tool can help us learn how closely related we might be to our matches and solve difficult family tree mysteries.
For example, if we share many small segments with a DNA match, it could indicate being related in a few different ways. Longer segments could point towards a more recent ancestor.
The ways in which the tool can help you with your genetic genealogy research are extensive!
Just a few of the specific details Gedmatch One to One tool can tell you:
- The total number of centimorgans that you share with your match
- The exact location on your chromosomes where you can find DNA segments shared with your match
- The estimated distance to your most recent common ancestor
How to use the Gedmatch One-to-One tool
The instructions below will help you get started using the One-to-One tool, but you will first need to log in to your Gedmatch account.
You can access the Gedmatch login page by clicking on the link below:
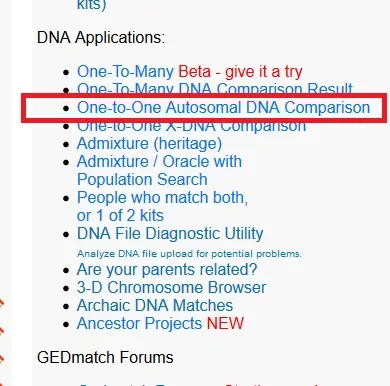
From your Gedmatch dashboard, which is the screen that you see once you have logged in to your account, you can find the One-to-One tool towards the right side of your screen under the "DNA Applications" heading.
In the image below, I have highlighted the One-to-One tool in red so you'll know exactly which tool we are learning about for this post:
Which information to enter in the One-to-One tool
Once you have opened up the Gedmatch One-to-One tool, you'll need to enter some information into some of the fields to get the tool to work.
You must enter:
- your kit number
- the kit number of the person that you'd like to compare with yours
The tool has several default settings, so it isn't necessary to change any of the other fields.
When I run the tool, I typically leave most of the fields as-is, but I do prefer to receive the results as a list. The default results setting is "Graphics and Position.".
To me, the results are easier to understand in the "Position Only" form. In the image below, you can see how to choose to receive your results in the "Position Only" form, too.
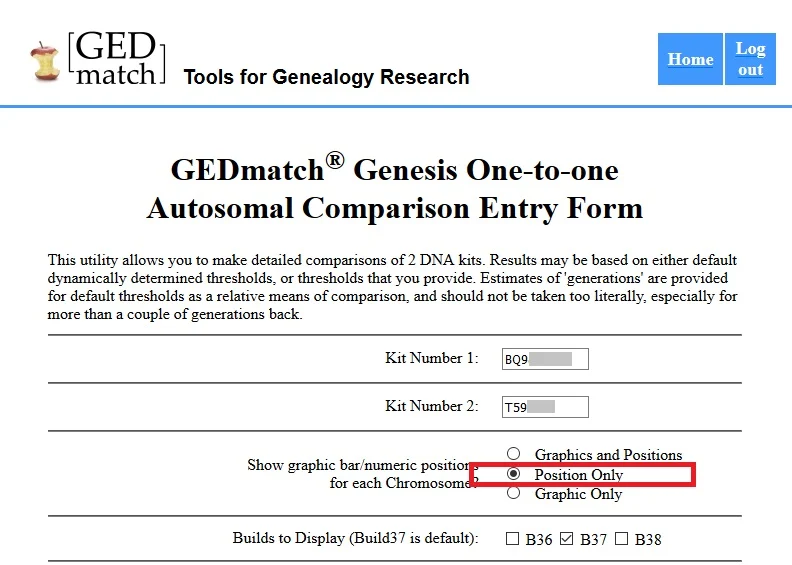
Once you have entered in your kit number as well as decided whether you would like the tool to display the results as "Graphics and Position" or "Position Only", you can scroll to the bottom of the page and press the "Submit" button.
How to understand the Gedmatch One-to-One results
After you have submitted the required information on the tool page, you will be able to view the results of the comparison.
If you have NO matching DNA segments, you will see a message that says "No shared DNA segments found ". If you chose to display both the graphics and the position, this message will appear at the very bottom (you'll have to scroll down to see it).
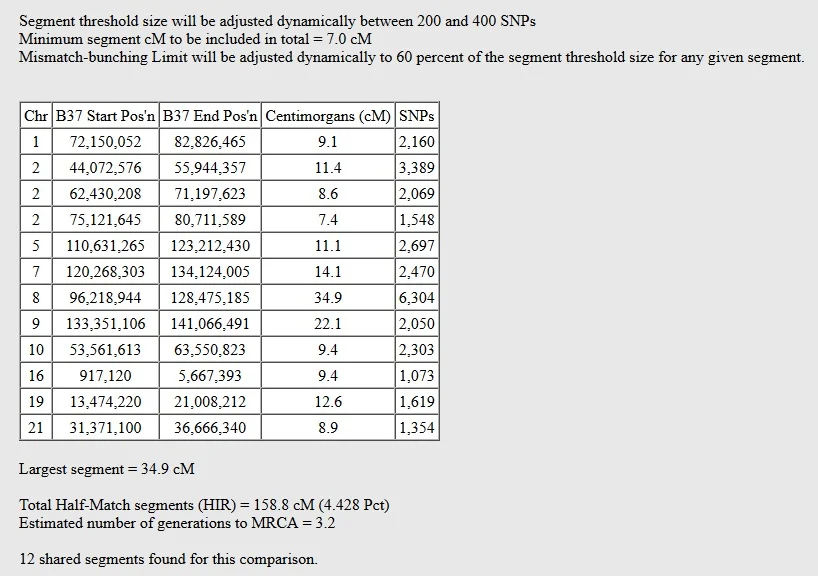
If you do have matching DNA segments with your match, you will receive results that look something like a spreadsheet table.
You might share only one DNA segment with your match, or several DNA segments, as show in the image below:
Meanings of the columns on Gedmatch tools
At first glance, you might think the results are too scientific and technical to understand. Trust me, if I can do it, you can do it!
- The first column of the results tells you the number of chromosome where you can find the matching segment.
- The second column displays the exact location of beginning of the DNA segment
- The third column tells you the exact location of the end of the DNA segment
- The fourth column (centimorgans) tells you exactly how long the DNA segment is
- The final column tells you how many SNPs were tested to measure the segment
Each person has 22 numbered chromosomes. I can see in the results above that the two people that I compared share 12 DNA segments on 10 of their 22 chromosomes.
At the very bottom of the One-to-One results, I can see a "summary" of the results, if you will.
Gedmatch explains that these two users have:
- A largest shared DNA segment of 34.9 cMs
- 158.8 cMs of shared DNA (of combined segments above 7 cMs in length)
- An estimated distance to most recent common ancestor of 3.2 generations
In order to really understand how these two individuals are related, I will need to inspect (and possibly even build) their family trees back far enough to spot their common ancestor(s).
Tool settings for Gedmatch One-to-One comparison
There are several tool settings that we can adjust in order to learn even more from the Gedmatch One-to-One comparison tool.
Why would you want to see the Graphics comparison on Gedmatch?
We already discussed the Position Only vs. Graphics and Position option above, but I didn't explain why you might want to see the graphics on your results.
In cases where you are closely related to a match (i.e. a sibling), you might be interested in comparing half-identical regions to full identical regions. These different regions are indicated on your Gedmatch tool results by the color-coded key near the top of the results page.
What's the difference between a fully identical region and a half-identical region?
Above, I mentioned that everyone has 22 numbered chromosomes. What I didn't say is that we actually have two copies of each chromosome.
We inherited one copy of each chromosome from each of our parents equaling about 50% of their DNA.
Our siblings also inherited 50% of our parents' DNA, but it won't be the exact same 50% that we inherited. Some will be identical, and overlap in "fully identical regions", meaning regions that match DNA inherited from both mom and dad.
To illustrate this, take a peek at the image below. It was taken from the One-to-One results comparing my full sister's DNA with my own:

The yellow regions are half-identical regions and the green are fully-identical. In other words, my sister and I inherited identical DNA from both of our parents (i.e. on both copies of the chromosome) in the regions shown in green.
The yellow regions indicate regions where my sister and I share identical DNA on only one copy of the chromosome. Our half-match could have come from either our mother or our father, since we share both.
Most of our DNA matches will only share "half-identical" regions with us because they are only related on one side of our family.
How to adjust the segment size threshold on the Gedmatch One-to-One tool
By default, the Gedmatch One-to-One comparison tool only displays DNA segments that are larger than 7 cMs in length. This is what you might call the "industry standard" of genetic genealogy.
The smaller the DNA segment, the higher the probability that the DNA segment is a false positive (identical by state) instead of a DNA segment inherited from a shared common ancestor.
The result of this is that you can feel relatively confident (it's all relative, right?) that most of the DNA segments that you share with your match are probably identical by descent.
By having a lower threshold of 7-8 cMs, testing companies (and Gedmatch) strike a nice balance between eliminating a good amount of false positives and providing us with enough information to learn as much as we can (or want to) about our family tree.
With all of this said, there are still some valid reasons that you might want to lower the threshold when you compare your DNA with that of your match.
Keeping in mind that more than 99% of segments as small as 3 cMs are going to be false positives, I lowered the threshold so you can see what the results look comparing the same individuals that I showed you above:
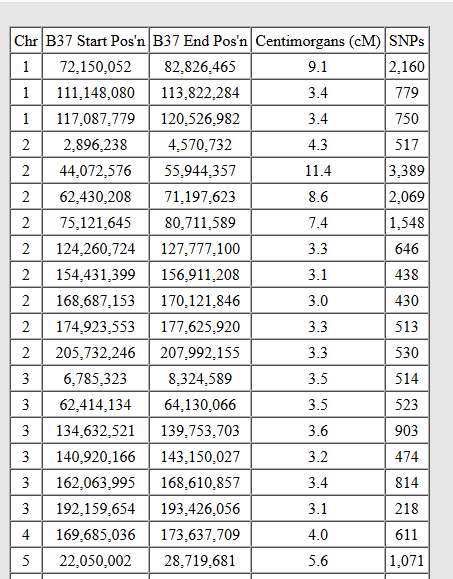
There were 62 DNA segments found at the 3 cM threshold or larger. Some of these segments were as small as 3.0, but others were as large as 6.7. The rest fell somewhere in-between.
The two people whose DNA I compared for this example are from the same town where their families have lived for many, many, many generations. Many, but not all, of these very small segments might be "true" matches.
Conclusion
I hope that this post has helped you understand more about how to use the Gedmatch One-to-One tool, how to understand the results, how to adjust the tool settings.
If you have any questions about something that you read in this post, or if you would like to share your own experience using this tool, I would love to hear from you in the discussion below.
Thanks for being here today!
