Is your MyHeritage DNA Ethnicity Estimate different than the one you got from Ancestry DNA or another testing site? You aren’t alone in spotting major differences in your ethnicity estimate.
Sometimes, they look different but they really aren’t – and other times they show just enough difference to warrant a closer look.
MyHeritage DNA is relatively new to the DNA testing scene, and they have been fairly aggressive about improving their service and their website.
Because so many of my readers have tested with MyHeritage DNA and have questions about their ethnicity estimates, I thought I would do a post comparing ethnicity estimates from My Heritage DNA to those of Ancestry DNA.
Before we get started, I want to clarify that I still recommend testing with Ancestry DNA as a start, and then uploading for free to MyHeritage DNA, as well as Family Tree DNA.
I have three different DNA tests that I will display here for comparison. Each person originally tested with Ancestry DNA and then uploaded their DNA to My Heritage DNA.
The experience of getting a different ethnicity result from MyHeritage DNA was different for each test taker, since their ancestry varies. I encourage everyone to get an “alternate” ethnicity estimate, whether it be from Gedmatch, FTDNA, or MyHeritage DNA.
You never know what you will discover.


When the MyHeritage DNA and Ancestry DNA results look different – but aren’t: Case Study #1
The first sample case that we will examine is “Jeannie”. Both of her parents were born in the United States, but of different heritage.
Her family tree has been traced on all sides as far back as great-great grandparents on all lines, and much further back on most lines.
Just so you’ll have a good idea of what she was expecting from her results, here is a summary of the birth place of all of her great-great grandparents:
- 4 great-great grandparents born in Slovakia
- 1 great-great grandparents born in Ireland
- 1 great-great grandparent born in Scotland
- 2 great-great grandparents born in United States (of presumed British/Irish heritage)
- 4 great-great grandparents born in Poland
- 4 great-great grandparents born in Germany
Totals:
- 50% Eastern European (combined Polish/Slovak)
- 6.25% Irish
- 6.25% Scottish
- 12.5% Unknown (presumed British/Scottish/Irish)
- 25% German (Western Europe)
The only “wild card” in Jeannie’s ancestry is contained within the DNA of her US born great-great grandparents. A few lines of their heritage can be traced as far back as the Mayflower – but it might be safe to assume that the Southeastern Bantu came into her line through one or both of these two great-great grandparents.
Below, you can see how MyHeritage DNA and Ancestry DNA “interpreted” her ethnicity, compared to their own proprietary reference samples. At first glance, they look very different.
If you look closer, however, you can see that they aren’t very different at all. Below the image, I will discuss the similarities and the small differences.

Analysis of results: Case Study #1 – her MyHeritage DNA results are slightly different than her Ancestry DNA results
The Eastern European on both results is similar, and I am assuming that the 10%, or so, difference between the two companies is due to MyHeritage detecting more Scandinavian DNA.
Many people from Britain and Eastern Europe have significant Scandinavian DNA – especially those who are from countries that have access to the sea, like Poland. We can assume that the much of the British that Ancestry detected was placed into the Scandinavia category on MyHeritage.
The Southern Europe category is almost identical – it is just called something slightly different on each site. 2% Italian or Iberian Peninsula (both ethnicities are often detected in both areas because of proximity)
The only significant different that I notice is that MyHeritage detects more than 5% African DNA – much more than we typically dismiss as “trace”. When Ancestry initially provided DNA results to Jeannie, she showed 2% Southeastern Bantu.
They refined their ethnicity estimate algorithm, and her results now report less than 1%. With the combined knowledge of the MyHeritage DNA ethnicity estimate, the fact that Ancestry had previously reported more African ancestry, and that two of her great-great grandparents have some unknown heritage, I would recommend that Jeannie take another look at her family tree.
(Another thing that Jeannie could do would be to check out some Admixture calculators on Gedmatch or Gedmatch Genesis)
When the MyHeritage DNA and Ancestry DNA results look different – and might be: Case Study #2
Our next example results come from “Billy”. Like Jeannie, Billy also has varied ancestry.
His ancestry has been more thoroughly traced back in all lines, and there is very little mystery -as far as we know.
The following is a breakdown of the birthplace of all of his great-great grandparents:
- 4 great-great grandparents born in Holland (the Netherlands)
- 4 great-great grandparents born in Germany
- 8 great-great grandparents born in the US (with primarily British ancestry)
Totals:
- 50% British (from the 8 great-great grandparents born in the US of known British ancestry)
- 25% Germany
- 25% Netherlands
Below the image, you can see the analysis of the comparison, and see what I found to be a significant difference between the ethnicity results from these two companies.
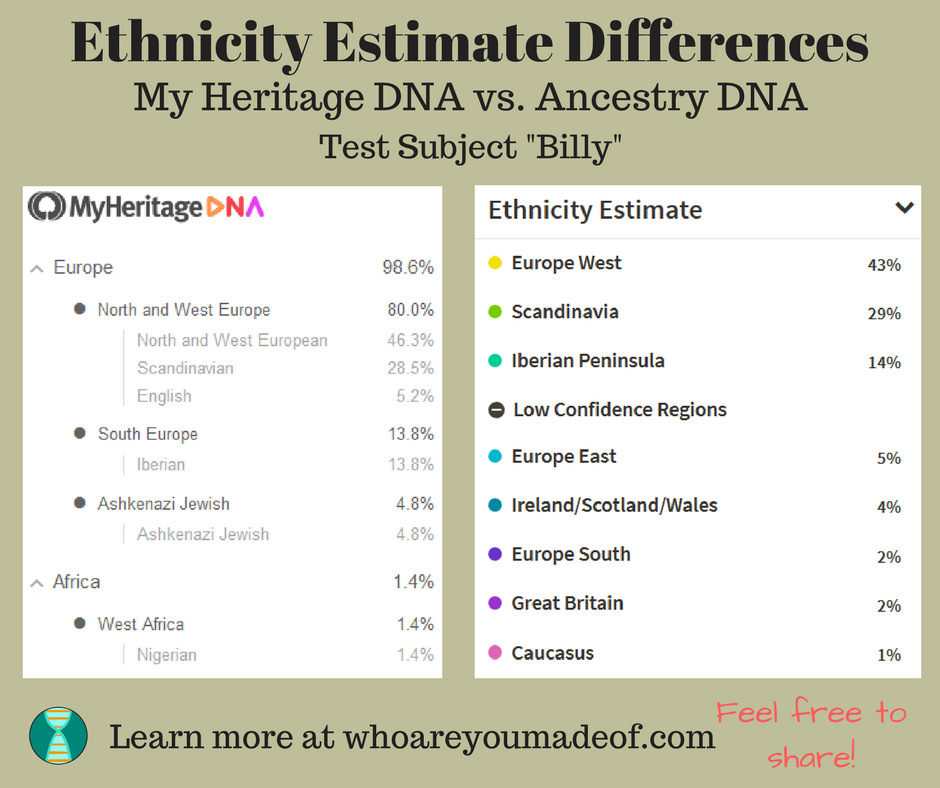
Analysis of results: Case Study #2 – his MyHeritage DNA results show slight important differences
Since we know that people who live in Britain can show many different ethnicities, including Scandinavian, Western Europe, and Iberian Peninsula (among many others), it’s fair to say that the Europe West, Scandinavia, Ireland/Scotland/Wales and Great Britain is all combined into the 80% North and West Europe on his MyHeritage DNA results.
The Iberian Peninsula detected on Ancestry is shown at almost the exact percentage as South Europe on MyHeritage – quite astonishingly.
The major difference that seems potentially significant to me is the 4.8% Ashkenazi Jewish that the MyHeritage DNA algorithm detected. Since Billy has 4 great-great grandparents from Germany, it seems plausible that at least one of them might have had Jewish roots.
Since he didn’t grow up with any knowledge of Jewish ancestry, I would recommend that he look more closely at this result.
When the MyHeritage DNA and Ancestry DNA look very different – and are: Case Study #3
The final example that I will present to you is a perfect display of two things: why DNA estimates should be viewed with skepticism in some cases, especially when the results are incredibly out of line with expected results and endogamy in Native American populations.
The test taker, Moe, has extensive Mexican ancestry. While his family tree has not been traced extensively, he comes from an indigenous town in central Mexico that has remained relatively isolated from migration and intermarriage.
All eight great-great grandparents, as far as we know, were born in Central Mexico – meaning that he would expect to find his Ancestry traced as 100% Mexican.
We know that there has historically been extensive immigration to Mexico (read about “Mexican DNA“), and that the indigenous peoples in Mexico share DNA ancestry with the indigenous peoples of the US and Canada – meaning that some Native American ancestry should be expected for someone from an indigenous town in Mexico.
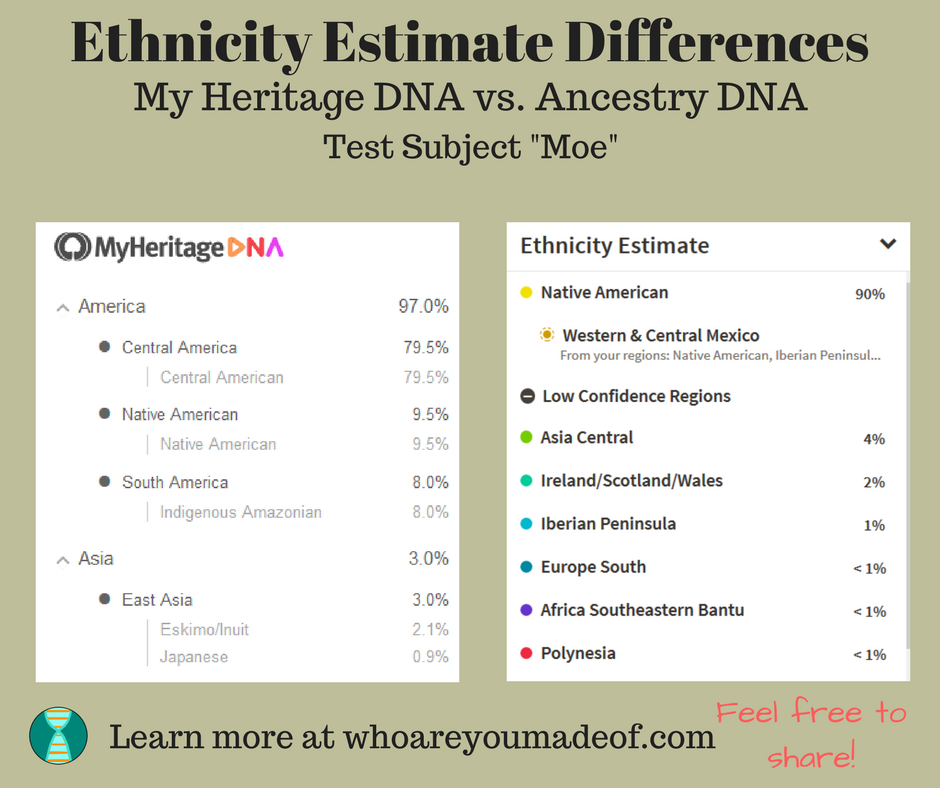
Analysis of results: Case Study #3 – his MyHeritage DNA appear to be completely wrong
The 90% Native American that showed up on Ancestry (and the sub-region of Western and Central Mexico) was higher than we expected, but seems very reasonable based on what we know about his ancestry.
The “Central American” reported by MyHeritage is slightly misleading. Central America is typically used to describe the area between Mexico and South America, but if you look at the area of the map corresponding to the region on MyHeritage’s interface, Mexico and Central America are clearly highlighted – meaning that the Central American part of his DNA that their algorithm detected is correct.
What is clearly “wrong” about the MyHeritage results is that this test taker has absolutely no reason to believe that he has Indigenous Amazonian heritage, much less Inuit or Japanese.
There is some evidence that he might have ancestors that migrated from the Southwestern United States at some point during the past couple of hundred years (based primarily on DNA matches) – meaning that the “Native American” reported might be correct.
Many people are also of the opinion that Native American is a term that should be equally applied to all of the indigenous peoples of the Americas – not just the people who descend from tribes that happen to fall within the current political borders of the United States.
The MyHeritage test seems to completely ignore the DNA that Ancestry detected to be Central Asian.
Central Asia is a very distinct geographic area from East Asia, and since Ancestry DNA detected 4% from this region, I would be inclined to suggest that there might be an ancestor from this area in his lineage within the past 300 years or less.
His European roots, which he clearly has, based on distant DNA matches and the European roots that showed up on Ancestry were passed completely undetected on MyHeritage. This test taker has run his DNA through various Gedmatch calculators, and has uploaded to FTDNA. All calculators detect as high as 13% European ancestry, except for the MyHeritage algorithm.
My final comments on Moe’s My Heritage results are concerning his Inuit, Japanese, and Amazonian ethnicities that were reported by My Heritage DNA.
Since the indigenous people who lived, and continue to live, on both the North and South American continents before the arrival of the Europeans are all descended from just a few (or possibly, just one) initial small group of people, everyone is related in many different ways – albeit very distantly – to everyone else.
To make matters more complicated, from a genetic genealogy perspective, these individuals formed communities and tended to intermarry within the local population. This is called endogamy, and is common in other parts of the world, as well.
This is why Moe’s DNA shows as a match to people in Canada or the Amazon, when he has no recent genealogical connection to those groups.
Conclusion
I hope that these case studies in the differences between the MyHeritage DNA and Ancestry DNA ethnicity estimates have helped shed some light on your own personal DNA ethnicity estimates.
If you have any questions, comments, concerns, or would just like to share your own experience, I would encourage you to leave a note in the comments.
Thanks for stopping by!
David
Wednesday 17th of August 2022
Hi, I took an ancestry DNA test and got 100% Irish. I uploaded the ancestry raw date to myheritage and am getting 96.3% Irish, Scottish and Welsh and 3.7 % Iberian. Finally I uploaded to family tree DNA and am getting 90% Irish, 8% Scandanavia and 2% southern Europe. Can you please comment on the validity of the results and whether the non-Irish components could be valid. Ive only been able to trace some of my family tree back past great grandparents and there is a definite 'spanish' look to my mothers side ie. brown eyes, sallow skin tone, dark hair. thank you!
Diana
Thursday 5th of January 2023
@David, My personal thought is that there is a great deal of exchange/migration between Celtic peoples from Northern Spain and other groups. That you go some Iberian should not be a surprise. I'm 80% Iberian and also got small percentage hits from Wales, Ireland, etc.
ponto
Sunday 19th of June 2022
They are estimates based on their reference groups and the algorithm they use. If they do not use your particular ethnic group as a reference your ancestry will be parceled out to something similar but not quite right. Also most people who have these tests are not one ethnicity from the same place for hundreds of years, but a mixed bag from different ethnic groups, and different regions. So those results will be far less accurate than for a mono ethnic person whose ancestors come from one defined region. Ancestry.com for me is spot on. I have ancestry from one ethnic groups for hundreds of years and is from a tiny island. MyHeritage does not use my ethnic group as a reference so it chops my ancestry using reference groups from nearby countries. On Ancestry.com I am 100% of my ethnic group which is correct.
Beameranged
Friday 5th of November 2021
These kinds of services rather seem like random number generators that should not be permitted to charge money.
ANCESTRY Scotland 30% European Jewish 27% England & Northwestern Europe 21% Ireland 21% Baltics 1%
FTDNA Ireland 51% Scandinavia 16% Central Europe 14% Ashkenazi Jewish 17% Italian Peninsula <1% Baltic <1% Sephardic Jewish <1%
MYHERITAGE Scandinavian 45.2% Italian 22.8% Ashkenazi Jewish 16.7% Irish, Scottish, and Welsh 14.0% Baltic 1.3%
Ken Barth
Tuesday 21st of September 2021
I took my DNA test through Ancestry and uploaded the results to My Heritage and Family Tree. Ancestry seems to be the most accurate based on what I know of my ancestry. My Hertiage has a significant amount of Iberian ancestry that is not reflected in the other two companies, and Family Tree has a significant amount of Greek ancestry that is not reflected in the other two.
Vicki Trusselli
Monday 1st of June 2020
I deleted my ancestry.com because I have already uploaded to GED match and 23 and me. My ancestry was not that far off from 23and me but then they changed my whole history of my DNA they removed all of southern Europe and Spain and Africa. Made me all white. That was after I found relatives melato in Capetown Africa. I also have Choctaw intermarriage with Irish et etc. My dad died of a Mediterranean luluekemi. I also have Baltic. Ancestry remove my Iberian and African and native American and said they decided I was all European northern. I deleted my account. Kept my GED and 23 and me. My GED Eurogenes K13 Admixture Proportions
This utility uses the Eurogenes K13 model (rev 21 Nov 2013), created by Davidski (Polako). Questions and comments about this model should be directed to him at his Project Blog.
Kit Number: A059870 Elapsed Time: 17.90 seconds
Population North_Atlantic 45.02 Baltic 25.32 West_Med 14.38 West_Asian 4.41 East_Med 7.80 Red_Sea 0.76 South_Asian 0.59 East_Asian 0.06 Siberian 1.23 Amerindian 0.07 Oceanian - Northeast_African - Sub-Saharan 0.31
22.18 Mediterranean 6.29 amerindian
4.41 .59 .06 1.23 .07 Web site and contents ©Copyright 2011-2018 by GEDmatch, Inc. Genealogy and DNA data remains the property of the submitter. Each Admixture Proportions 'calculator' model remains the property of its developer.
171969 SNPs used in this evaluation